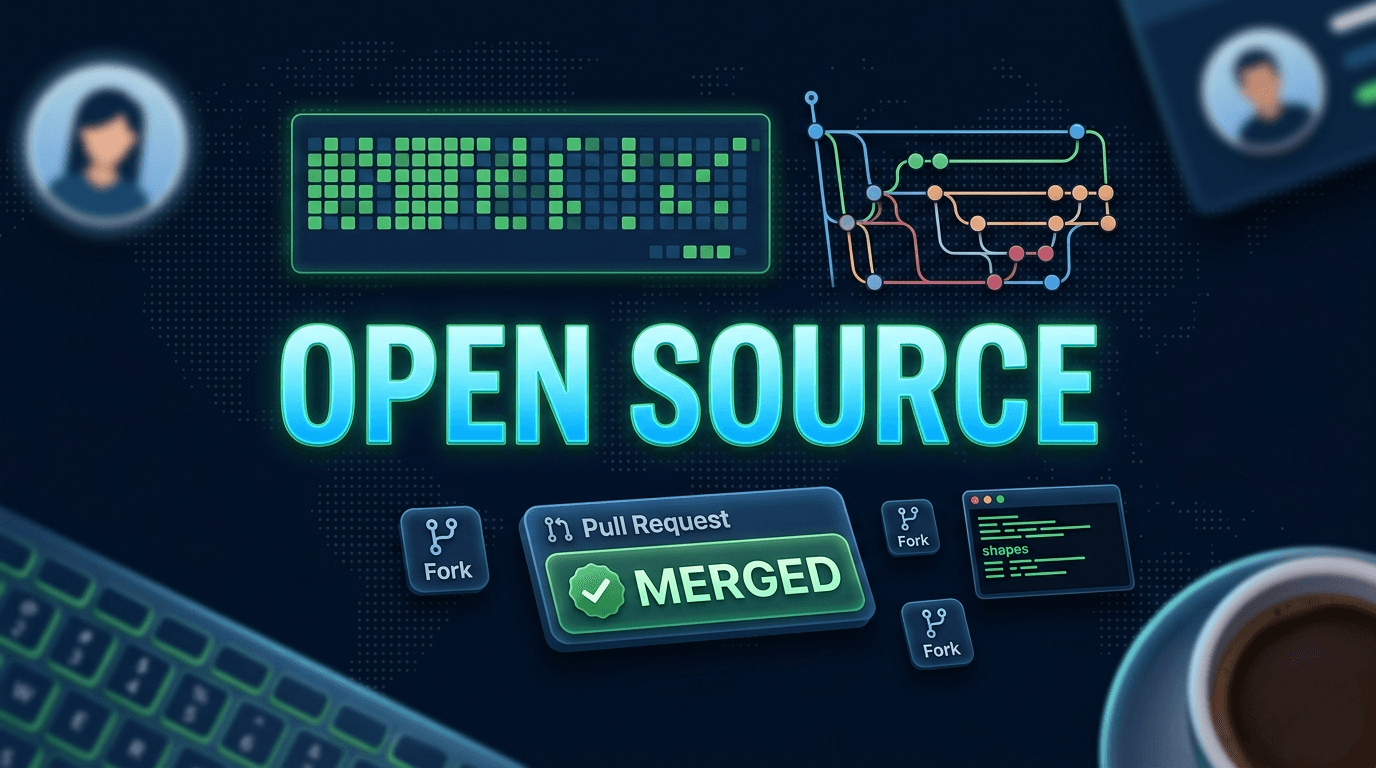
Monitoring and observability are not the same thing. I didn't fully get that until I started contributing to OpenTelemetry. Here's what 5 merged PRs taught me that no course could.
The Word Everyone Uses, But Few Actually Understand (I Was One of Them 😅)
If you're in tech, you've heard observability thrown around like it's just a fancy word for monitoring. It's not. The difference is subtle but it completely changes how you think about building systems.
Monitoring is asking: "Is something broken?" You set up dashboards, alerts, thresholds. You know what questions you're going to ask before things go wrong. It's reactive.
Observability is asking: "Why is something broken.. even when I don't know what to look for?" It's the ability to understand your system's internal state just by looking at its outputs. It's proactive. It's exploratory.
Think of it like this:
Monitoring is a smoke detector. Observability is being able to figure out exactly which wire in the wall started sparking, and why, without tearing open the wall.
In a world of microservices, distributed systems, and cloud-native apps monitoring alone isn't enough. You need observability.
The 3 Pillars of Observability (Here's How I Actually Understand Them)
Every observability resource will hit you with Logs, Metrics, and Traces. Here's what they actually mean in plain language:
🪵 Logs: The Diary
Your app writing down what it did, moment by moment.
- "User logged in at 10:32 AM"
- "DB query failed with timeout"
Great for debugging specific events. Terrible for seeing the big picture.
📊 Metrics: The Vitals
Numbers over time. CPU at 80%. Response time at 240ms. Error rate at 0.3%.
Great for dashboards and alerts. But they tell you what is happening, not why.
🔍 Traces: The GPS Trail
This is the powerful one. A trace follows a single request as it travels through your entire system, service A calls service B calls a DB calls a cache. Every hop is recorded.
When your app is slow and you have no idea which microservice is the culprit then like traces are your answer.
Together, these three give you full observability. Remove any one of them and you're flying partially blind.
"OpenTelemetry" - Why Every Big Tech Company Quietly Standardized Around It
Here's the problem before OTel existed: every tool had its own way of collecting logs, metrics, and traces. Datadog had one format. Jaeger had another. Prometheus had its own. You'd get locked in.
OpenTelemetry (OTel) is an open-source, vendor-neutral standard that lets you instrument your code once and send that telemetry data anywhere like to Grafana, Datadog, Jaeger, whatever you want.
It's backed by CNCF (the same foundation behind Kubernetes). Grafana, Datadog, AWS, Google Cloud, Microsoft; they've all standardized around it. It's not a trend. It's the future of how all software gets observed.
If you're aiming for SRE roles at companies like Grafana or Datadog, OTel is not optional knowledge. It's table stakes.
My Story: From a Clueless Developer to Open Source Contributor
It started, honestly, pretty unglamorously. I had my own project running and something was off. The app was up, no crashes, no obvious errors. But I had absolutely no idea what was happening inside. No visibility. Nothing.
That frustration is what pushed me toward observability. And once I started going deeper, one thing kept coming up and end to up to OpenTelemetry. So I did what made sense: go straight to the source and contribute.
Finding My First Issue (Easier Said Than Done)
I opened the OTel GitHub thinking I'd find something quickly. What I found instead was a maze.
There's collector, collector-contrib, otel-js, otel-js-contrib, otel-py, otel-py-contrib and that's just the start. Each repo has its own conventions, its own scope, its own community.
I spent time just understanding what each piece does: instrumentation, the API, the collector, how they all connect.
The good first issues in the core repos? Either already taken or way over my head at that point.
Then I found otel-explorer, a smaller repo with issues that were actually approachable. That's where I started.
The Real Learning Happened in the "Smaller" Repo
I contributed 4-5 PRs to otel-explorer. And honestly? This is where I learned everything that actually matters about OSS contribution. Not the code part, but the craft part:
How to write a proper PR description How to talk to maintainers on GitHub and Slack How async coordination works in a global open source team How to pick up new concepts on the fly while mid-contribution
Side by side, I was slowly getting comfortable with the core OTel repos too.
Then I Started Going Wider
Once the contribution flow clicked, I started exploring beyond otel-js, otel-js-contrib, grafana/alloy, grafana/beyla and prometheus.
Solved an issue on alloy (still under review). Learned about beyla along the way, which I hadn't even heard of before.
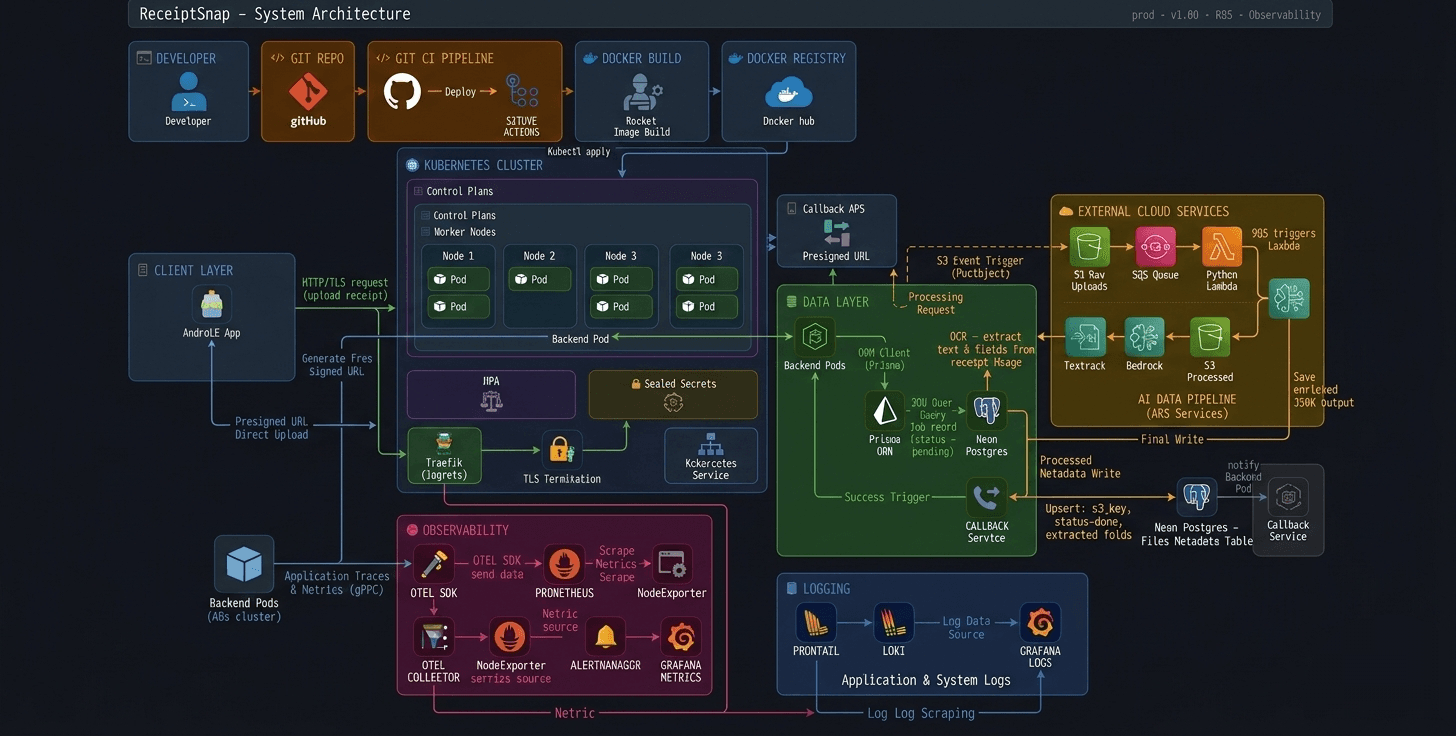
In about 20 days I went from overwhelmed-by-repo-list to knowing exactly how the observability pipeline flows end to end, and confident enough to implement it on my own project. (I actually already wrote a full blog on that: Read it here)
What This Changed For Me
1. I write backend code differently now. When I build something in Node.js, I'm already thinking like of how would I trace this? What metrics matter here? What logs will actually help me debug at 2 AM? Observability isn't an afterthought anymore. It's part of the design.
2. I understand what SRE actually means. SRE isn't just "DevOps with a fancier title." It's about reliability engineering and you can't engineer reliability without deep observability. OTel gave me that foundation.
3. My OSS profile is now a conversation starter. When I talk to recruiters or engineers at companies like Grafana or Datadog, I'm not just saying "I know observability." I have merged PRs in the ecosystem they work in every day. That's a different kind of credibility.
If You're a Fresher Eyeing SRE Roles, Start Here
LeetCode and DSA are important, but they're not enough on their own. Start with understanding observability and then contribute to OTel. That's what actually sets you apart.
Here's a simple path:
- Read the OTel docs — get the concepts down
- Instrument a small Node.js or Go app with OTel — make it real
- Go to the OTel GitHub, filter
good first issue, pick something small - Join the CNCF Slack — the community is genuinely helpful
- Be patient with the first PR. The rework is the learning.
The companies you want to work at, Grafana, Datadog, AWS, FAANG SRE teams, they all live in this world. Speak their language before you walk in the door.
Wrapping Up
Observability is one of those things that sounds like jargon until it clicks and then you can't imagine building systems without thinking about it. My OTel contribution journey forced that click for me faster than any course could.
I'm still learning. Still contributing. Still figuring out this whole SRE path as a final-year student. But I'm doing it in public, in real codebases, alongside people who are building the tools the industry runs on.
That feels like the right way to learn.
Next Week
Next up, I'm writing a complete guide on OSS contribution for freshers, from finding the right repo to getting your first PR merged, with all the git commands, forking, syncing, and everything in between. Hit me up on Twitter if you want something specific covered.
If you're on a similar path, learning OTel, contributing to CNCF projects, or figuring out SRE, I'd love to connect. Drop a comment or find me on LinkedIn and Twitter.