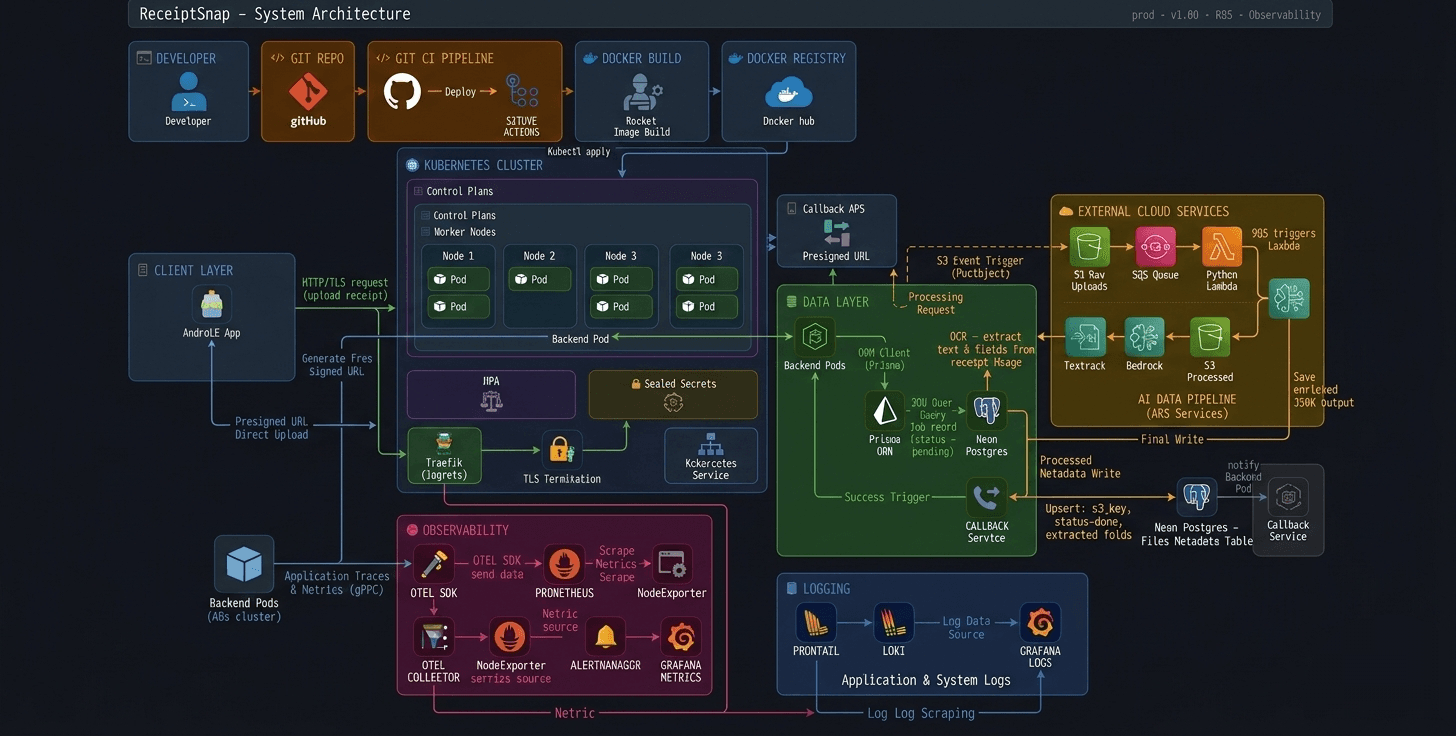
When I first built ReceiptSnap on EC2 with Docker, I had no monitoring whatsoever. If something broke, I'd SSH in, check logs manually, and hope for the best. That was it.
Then I decided to move to Kubernetes — not because I had to, but because I wanted to build something that actually resembles a production system. Not another tutorial project. A real one.
But the moment I got my Node.js app running on DigitalOcean DOKS, a new question hit me: my pods are running — but what's actually happening inside them? Is latency spiking? Are errors silently failing? Is my HPA scaling for the right reasons?
I had no idea. And that's exactly when I realized — a running app and an observable app are two very different things.
The Stack I Chose
Before writing a single line of instrumentation code, I spent time reading about OpenTelemetry — what it is, why it exists, and why the community rallied around it. The answer was simple: vendor-neutral observability. One standard, any backend.
That curiosity eventually led me to contribute to the OpenTelemetry project under CNCF. And somewhere along the way I thought — I'm contributing to this thing, why not actually use it in my own app?
My implementation isn't deep or complex. But it's real, it's running in production on Kubernetes, and it gives me exactly what I need:
Express App → OTel SDK → OTel Collector → Prometheus → Grafana
Prometheus and Grafana because they're the de facto standard in the Kubernetes ecosystem. OTel because once you understand it, everything else becomes plug-and-play.
Setting Up OTel in Node.js
Here's my entire instrumentation.ts. Yes, it's short. That's kind of the point.
import { NodeSDK } from '@opentelemetry/sdk-node';
import { getNodeAutoInstrumentations } from '@opentelemetry/auto-instrumentations-node';
import { OTLPMetricExporter } from '@opentelemetry/exporter-metrics-otlp-http';
import { PeriodicExportingMetricReader } from '@opentelemetry/sdk-metrics';
import { resourceFromAttributes } from '@opentelemetry/resources';
import { ATTR_SERVICE_NAME, ATTR_SERVICE_VERSION } from '@opentelemetry/semantic-conventions';

const sdk = new NodeSDK({
    resource: resourceFromAttributes({
        [ATTR_SERVICE_NAME]: 'receiptsnap-backend',
        [ATTR_SERVICE_VERSION]: '1.0.0',
    }),
    metricReader: new PeriodicExportingMetricReader({
        exporter: new OTLPMetricExporter({
            url:
                process.env.OTEL_EXPORTER_OTLP_ENDPOINT ??
                'http://otel-collector:4318/v1/metrics',
        }),
        exportIntervalMillis: 10000,
    }),
    instrumentations: [
        getNodeAutoInstrumentations({
            '@opentelemetry/instrumentation-fs': { enabled: false },
        }),
    ],
});

sdk.start();

process.on('SIGTERM', () => {
    sdk.shutdown().finally(() => process.exit(0));
});
Let me break down what's actually happening here:
Resource — tells OTel who is sending the data. Service name and version get attached to every metric, so in Grafana you always know which service you're looking at.
OTLPMetricExporter — pushes metrics over HTTP to the OTel Collector running inside the cluster at port 4318. The endpoint is environment-driven so local dev and Kubernetes both work without changing code.
PeriodicExportingMetricReader — exports every 10 seconds. Not real-time, but more than enough for most use cases.
getNodeAutoInstrumentations — this is the magic. One line and OTel automatically instruments Express routes, HTTP calls, DB queries via Prisma — no manual spans needed. I disabled instrumentation-fs because file system noise wasn't useful for me.
SIGTERM handler — when Kubernetes kills a pod during rolling updates, this ensures metrics are flushed cleanly before shutdown. Small detail, real impact.
Is this a deep OTel implementation? No. But it's intentional — I needed HTTP metrics out of my Express app running on Kubernetes. This does exactly that, nothing more.
Deploying OTel Collector on Kubernetes
The OTel Collector is the middleman — it receives metrics from the app, processes them, and exports to Prometheus. I deployed it via Helm using the contrib image which has more exporters than the core image.
image:
  repository: otel/opentelemetry-collector-contrib
mode: deployment

config:
  receivers:
    otlp:
      protocols:
        http:
          endpoint: 0.0.0.0:4318
        grpc:
          endpoint: 0.0.0.0:4317

  processors:
    batch: {}
    memory_limiter:
      check_interval: 1s
      limit_mib: 256

  exporters:
    prometheus:
      endpoint: "0.0.0.0:8889"
    debug:
      verbosity: basic

  service:
    pipelines:
      metrics:
        receivers: [otlp]
        processors: [memory_limiter, batch]
        exporters: [prometheus, debug]

ports:
  otlp-http:
    enabled: true
  prometheus:
    enabled: true
    containerPort: 8889
    servicePort: 8889

podAnnotations:
  prometheus.io/scrape: "true"
  prometheus.io/port: "8889"
  prometheus.io/path: "/metrics"
Breaking it down:
Receivers — Collector listens on port 4318 (HTTP) and 4317 (gRPC) for incoming OTLP data. My Node.js app pushes to 4318.
Processors — memory_limiter keeps the Collector from eating too much RAM on my small 2GB nodes. batch groups metrics together before exporting — more efficient than sending one-by-one.
Exporters — prometheus exposes metrics at port 8889 in a format Prometheus can scrape. debug was useful during setup to see what's actually flowing through.
Pipeline — the flow is explicit: otlp → memory_limiter → batch → prometheus. Clean, readable, no surprises.
podAnnotations — this is how Prometheus discovers the Collector automatically inside Kubernetes. Three annotations and Prometheus knows exactly where to scrape.
One thing worth noting — I'm running Collector in deployment mode, not daemonset. For my use case with a single backend service, one Collector instance is enough.
ServiceMonitor — Telling Prometheus Where to Scrape
The OTel Collector is exposing metrics at port 8889. But how does Prometheus know that? That's exactly what ServiceMonitor does.
apiVersion: monitoring.coreos.com/v1
kind: ServiceMonitor
metadata:
  name: otel-collector
  namespace: monitoring
  labels:
    release: monitoring
spec:
  selector:
    matchLabels:
      app.kubernetes.io/name: opentelemetry-collector
  endpoints:
    - port: prometheus
      path: /metrics
      interval: 15s
This is a custom resource that comes with kube-prometheus-stack. Instead of manually editing Prometheus config files, you just apply this — and Prometheus automatically picks it up.
selector — finds the OTel Collector service using its label. No hardcoded IPs, no manual config.
endpoints — scrape the prometheus port (8889) at /metrics every 15 seconds.
release: monitoring label — this is important. kube-prometheus-stack only watches ServiceMonitors that have this label. Miss this and Prometheus silently ignores your monitor. Small thing, costs you a lot of debugging time.
Once this is applied, the full pipeline is live:
Express App → OTel SDK → OTel Collector → Prometheus → Grafana
No more blind spots.
The PromQL Queries That Actually Matter
Once Grafana was connected to Prometheus, I needed three dashboards — nothing more. RPS, latency, errors. That's it. If these three are healthy, my app is healthy.
Request Rate (RPS)
sum(rate(http_server_duration_milliseconds_count{
  exported_job="receiptsnap-backend",
  http_route!=""
}[1m]))
How many requests per second is my app handling. http_route!="" filters out internal noise — only real API routes.
P95 Latency
histogram_quantile(0.95, sum by(le) (
  rate(http_server_duration_milliseconds_bucket{
    exported_job="receiptsnap-backend",
    http_route!=""
  }[5m])
))
95th percentile latency — meaning 95% of requests are faster than this number. This is the honest metric. Averages lie, P95 doesn't.
Error Rate
sum(rate(http_server_duration_milliseconds_count{
  exported_job="receiptsnap-backend",
  http_status_code=~"5.."
}[1m])) or vector(0)
5xx errors per second. or vector(0) ensures the panel shows 0 instead of "No data" when there are no errors — small but important for clean dashboards.
Three panels. That's my entire Grafana setup. And under load test these three told me everything I needed to know.
When Traffic Hit — HPA in Action
Theory is one thing. Watching your cluster actually respond to load is another.
I ran a load test and watched kubectl get hpa -n backend-team -w live. Here's exactly what happened:
    cpu: 1%/70%,   memory: 37%/80%  →  2 pods  (idle)
    cpu: 101%/70%, memory: 42%/80%  →  2 pods  (HPA deciding)
    cpu: 391%/70%, memory: 44%/80%  →  3 pods  (scaling triggered)
    cpu: 271%/70%, memory: 42%/80%  →  6 pods  (max scale)
    cpu: 248%/70%, memory: 43%/80%  →  6 pods  (absorbing load)
    cpu: 148%/70%, memory: 43%/80%  →  4 pods  (load dropping)
    cpu: 1%/70%,   memory: 42%/80%  →  6 pods  (cooldown)
And Grafana confirmed what HPA was doing made sense:
    Metric         |   Result
    Requests/sec  ->   224 RPS
    P95 Latency   ->   1.19s
    Avg Latency   ->   890ms
    Error Rate    ->   0% (27,018/27,018 ✅)
27,018 requests. Zero errors. That's not luck — that's what observability gives you confidence to prove.
Without Grafana I would have just seen "app is running." With it, I could see exactly how it behaved under pressure.
What I Learned
I started this project wanting to build something production-grade — not a tutorial clone, not a demo. And observability ended up being the piece that made it feel real.
Not because the implementation is complex. It isn't. But because for the first time I could look at my running system and actually understand what it was doing — not just hope it was fine.
A few things I'd tell myself before starting:
release: monitoringlabel on ServiceMonitor. Miss it and Prometheus silently ignores you.- P95 over averages, always. Averages hide the pain your slowest users are feeling.
If you're building on Kubernetes and you're still SSH-ing into pods to debug — this stack is worth setting up. It's not as intimidating as it looks, and the clarity it gives you is worth every YAML file.
What's Next
This is just the beginning of the observability journey for ReceiptSnap.
Metrics are live. But a complete observability stack has three pillars — metrics, traces, and logs. I've got one.
Next up:
- Distributed Tracing with OTel — actually seeing request flow across services, not just aggregate numbers
- Loki for log aggregation — structured logs alongside metrics in Grafana
- ArgoCD — replace
kubectl applywith proper GitOps
I'll write about each as I build them. Follow along on Hashnode and stay active on this Blog page i'll bring more like this. if you want to see how this evolves.
The code is open source — ReceiptSnap Backend (prod branch). Go explore.